North Carolina Gov. Roy Cooper continues his mantra that his decisions on closing down the state’s economy and keeping it closed are based on “the science, the data and the facts.”
So when his top scientist, Secretary of the North Carolina Department of Health and Human Services Dr. Mandy Cohen, at a press conference, doesn’t have all the data, it raises questions.
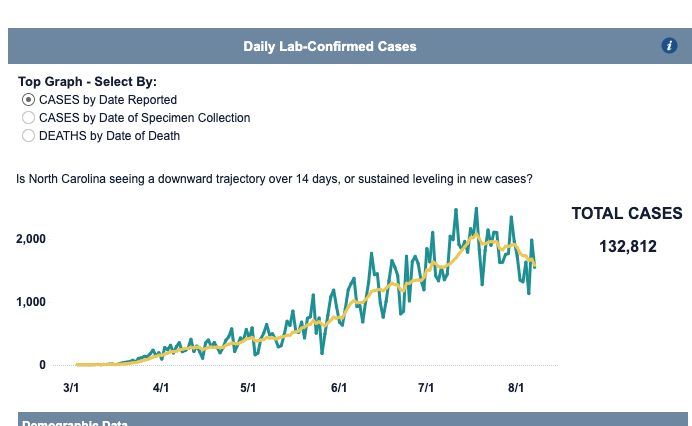
Cohen and Cooper said that the data didn’t indicate enough improvement in the COVID-19 numbers to move the state into Phase 3, which according to Cooper’s reopening plan was supposed to happen on June 26. Now, Cooper has delayed that next step in the reopening of the economy until at least Sept. 11.
But Cohen in her presentation announced that because of a “reporting omission from a few labs,” she didn’t have the data for the past three days, which were Monday, Aug. 3 through Wednesday, Aug. 5.
That data has now been released and it shows for those three days the number of new COVID-19 cases continued its downward trend.
If those three days had been on the chart, the continued drop in the number of new cases would have been more pronounced.
On the last day on the chart Cohen presented at the press conference, Sunday, Aug. 1, the number of new COVID-19 cases was 1,341. The recently released NCDHHS data shows 1,313 positive cases for Monday, Aug. 3, for Tuesday, Aug. 4 there were 1,649 positive cases and there were 1,127 positive cases for Wednesday, Aug. 5.
All of these indicate a significant drop in the number of new positive cases from July 18, when there were 2,481 new positive cases reported.
So if Cohen had presented all the data, the chart would have shown a downward trend that continued for three more days and the yellow line that indicates the seven-day average would have continued down.
By erasing three days of the chart, due to a “reporting omission,” the chart looked a little worse than the data indicated.
For those who believe in coincidences, this was a very convenient coincidence for Cooper and Cohen.

To paraphrase a scene from “Casablanca”
Uncle Roy: “I’m shocked, shocked to have to make this decision to continue the shutdown based on the data.”
Aunt Mandy: “Your missing data sir.”
Uncle Roy: “Oh thank you…wait, what data?.”
But hey, according to some people this whole thing is just a conspiracy theory.
MW and Lizzy don’t want you to talk about such things, John.
They don’t want you to question why a bar is more dangerous than a brewery.
They don’t want you to question why alcohol at 11:01 is more dangerous than alcohol at 10:59.
They don’t want you to question why protesting to support police is more prone to spread Covid than BLM priests.
They don’t want you to question why schools opened in the rest of the industrialized world when death rates were peaking there in April, May, and June with no spiking of deaths, hospitalizations, or cases, yet American schools must stay closed indefinitely.
MW, Lizzie, and those like her also want you to forget that Governor Dictator banned churches until a federal judge intervened and recognized that you have the right to worship as you see fit, and the only other person who has a say is your pastor.
They also don’t want you to question what is a bigger threat: a structured and well thought out reopening, or keeping people away from their jobs, their schools, their families, and their friends. There have already been many lives lost due to suicide, traffic accidents based on altered patterns, delayed medical procedures, increased stress related diseases that led to death and decreased quality of life. Nope, don’t ever think about those things, or weigh what has a bigger long term impact.
The State of NC will reopen on Friday Nov. 6th . Look that date up in relationships to the national
election.
This whole shutdown thing was to prevent overwhelming the healthcare system. The state chart shows we are at about 50% utilization.
Tell me again how the science and statistics is how Cooper is making these illegal decisions on his own? Lock him up!!!
Denial isn’t just a river in Africa, it’s where the Rhino continues to bathe. Numbers up, numbers down, deaths down, deaths up….doesn’t matter. You keep downplaying the Pandemic. Reminds us of a certain “leader” in Washington.
Lot of truth in that. The real point is that the country is dying of inactivity, not covid. Even a vaccine only will be partially effective. We either move on, or the whole country will die. Each person can weigh their own risk. We are not subject to diktat. Only “Back in the USSR”.
The Rhino serves a real forum for free speech. We can all disagree. No one exists who thinks exactly the same as another. What people want to see and hear is a different perspective. After all, we all are wrong wrong about some things.