At Thanksgiving this year, a lot of families may be arguing about politics – something High Point University polls about quite often – however, at this time of year the university conducts a poll on a thankfully lighter topic: pie preferences.
Pumpkin pie continues to rule the dessert table in North Carolina –and now across the entire country – according to the newest High Point University Poll.
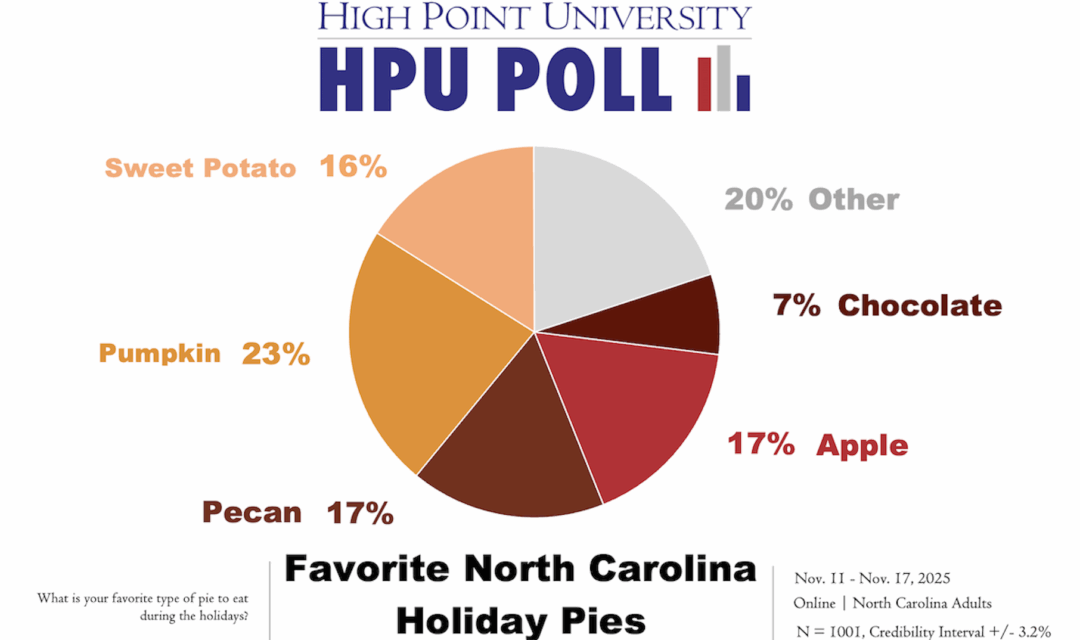
In results released November 25, the poll found that 28 percent of United States residents chose pumpkin pie as their favorite holiday pie, while 23 percent of North Carolinians put it at the top of the list. It marks the fifth straight year the fall favorite has led the pack in North Carolina and it’s the first time the pollsters have taken their pie rankings national.
Apple, pecan, chocolate and sweet potato pies rounded out the national top tier. Apple came in at 16 percent, pecan at 14 percent, chocolate at 10 percent and sweet potato at 10 percent.
Other pies that made the list in single-digit territory included cherry, blueberry, key lime, strawberry and peach.
North Carolina residents weren’t far off from the national trends. After pumpkin pie, pecan and apple were tied at 17 percent each, with sweet potato right behind them at 16 percent. Chocolate, key lime, cherry, peach, blueberry and strawberry pies fell below the 10-percent mark.
Those findings are consistent with earlier HPU Polls from 2021 through 2024, which also showed pumpkin pie at No. 1 and pecan pie in second place.
Now, according to the newest figures, pecan and apple appear to be running neck and neck.
One HPU professor noted that her own family’s tastes aren’t reflected in any of the categories.
“I know it’s not on the list, but hands down the fan favorite in our family is Grandma’s peanut butter pie,” said Debbi Brock, associate professor of entrepreneurship in the university’s David S. Congdon School of Entrepreneurship.
The poll numbers come from two separate online surveys conducted by the High Point University Survey Research Center this month. One survey sampled United States residents and the other sampled North Carolina residents, with 1,004 and 1,001 respondents respectively.
Because the respondents were drawn from opt-in panels rather than random sampling, the center doesn’t assign a traditional margin of sampling error. Instead, the Survey Research Center provides a “credibility interval” of plus or minus 3.2 percentage points for the North Carolina sample and plus or minus 3.1 percentage points for the national one. The data were weighted for age, gender, race and ethnicity based on U.S. Census benchmarks for the state and the nation.

Any of those will be just fine. I can make a good pumpkin pie. Crust baked with graham crackers & oreos, just for openers.
—————–
I sometimes get pie-eyed over Christmas. Does that count?
Drinking beer isn’t as difficult as cooking. In fact, it’s as easy as… oh, never mind.
Look up “Atlantic Beach Pie”. Wunderbar.
key lime lemon meringue cheesecake face pie(cool whip) – for clown pizza pie my fav
———–
And President Trump called Tim Walz a retard! Great stuff!
takes one to know one